OCR for historical archives
A comparison of text recognition engines
Which OCR engine should you point at a box of archive scans? We built a fixed corpus of Los Angeles stage and picture-palace ephemera, generated reference transcripts, and measured every engine we could install against every document. This is that work, in order.
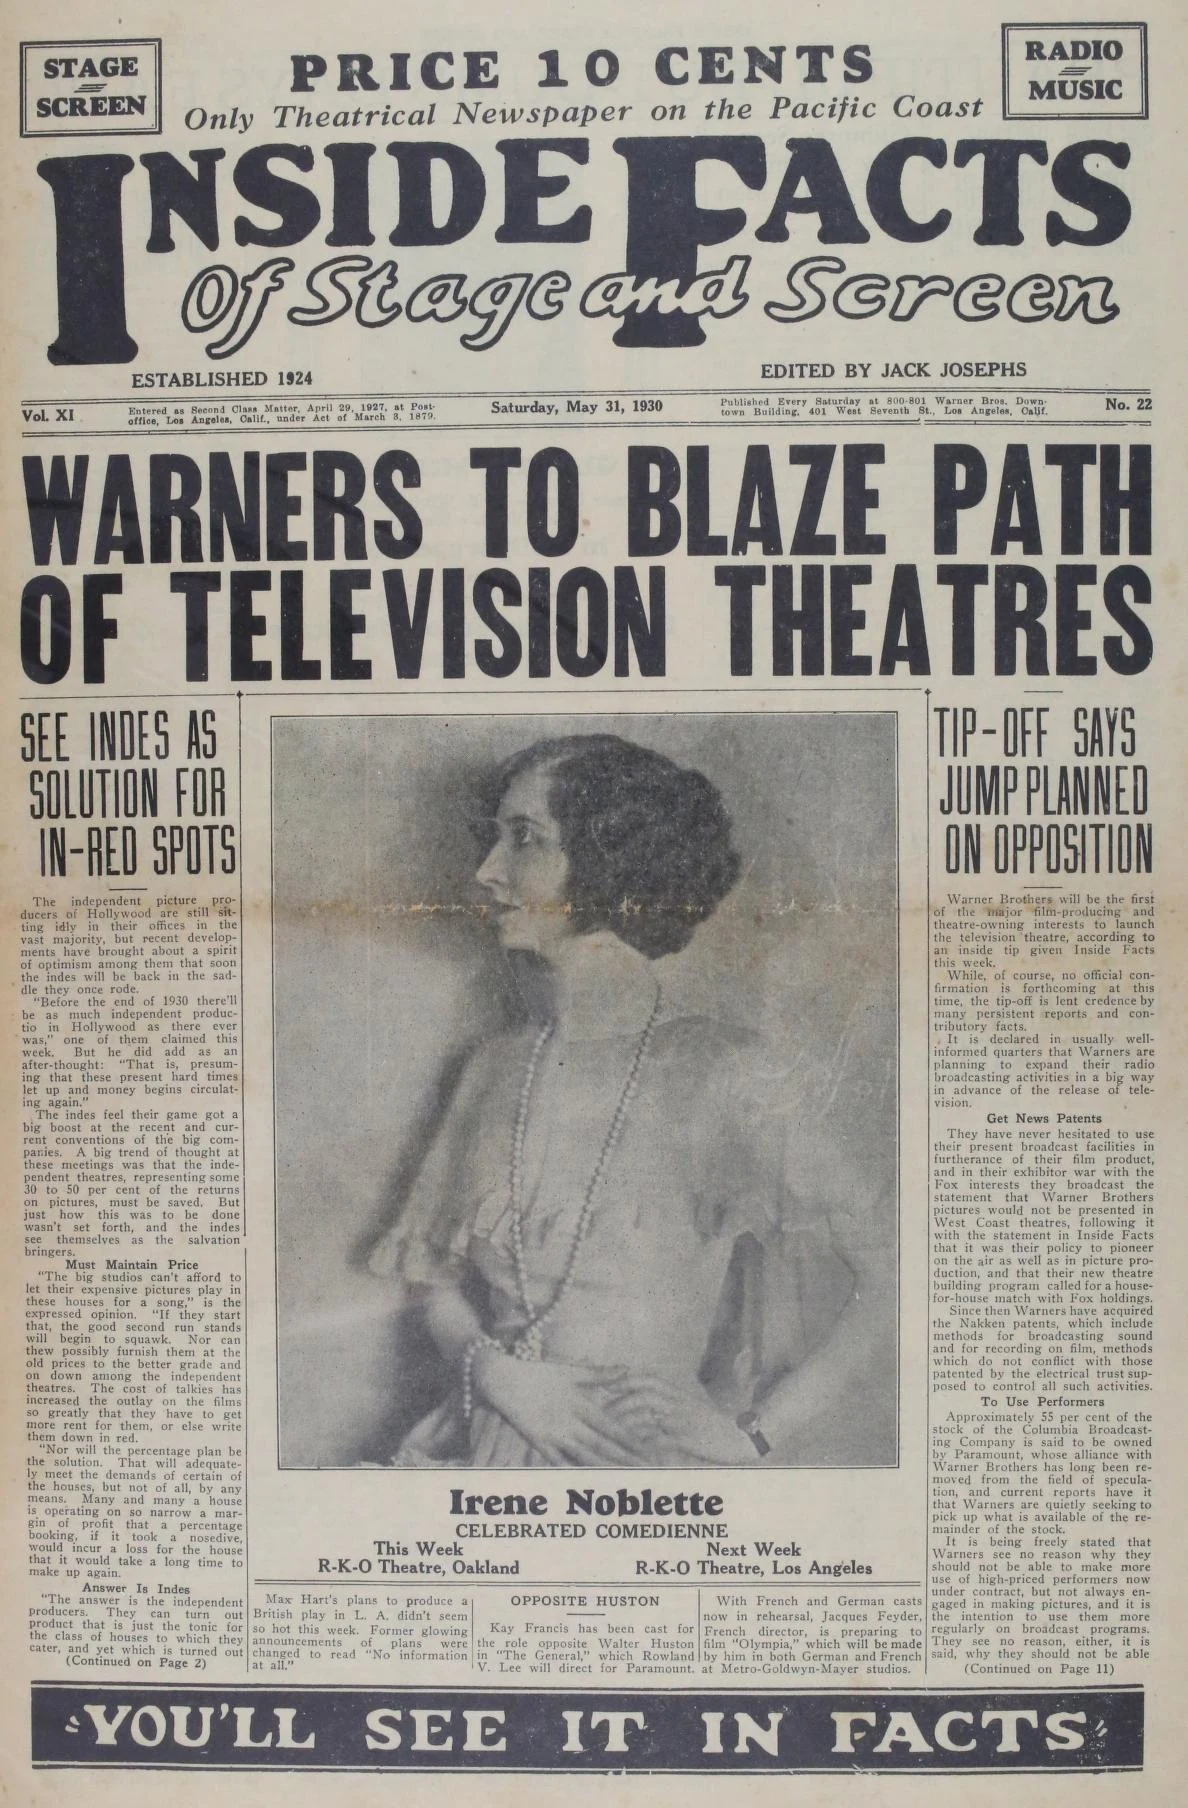
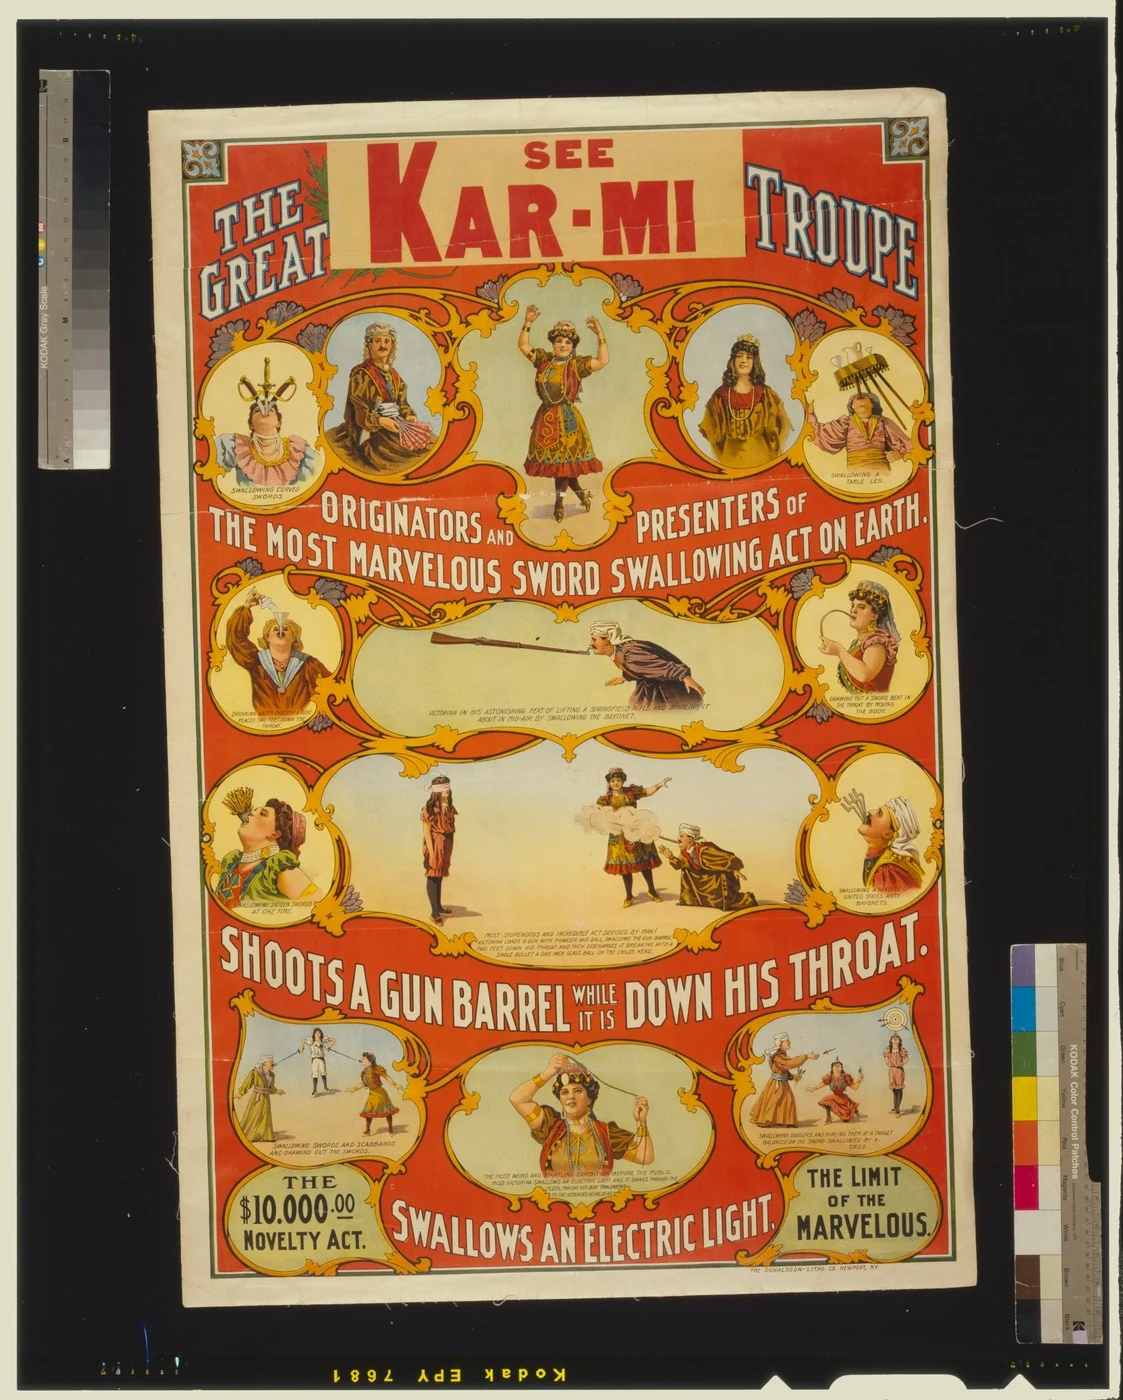
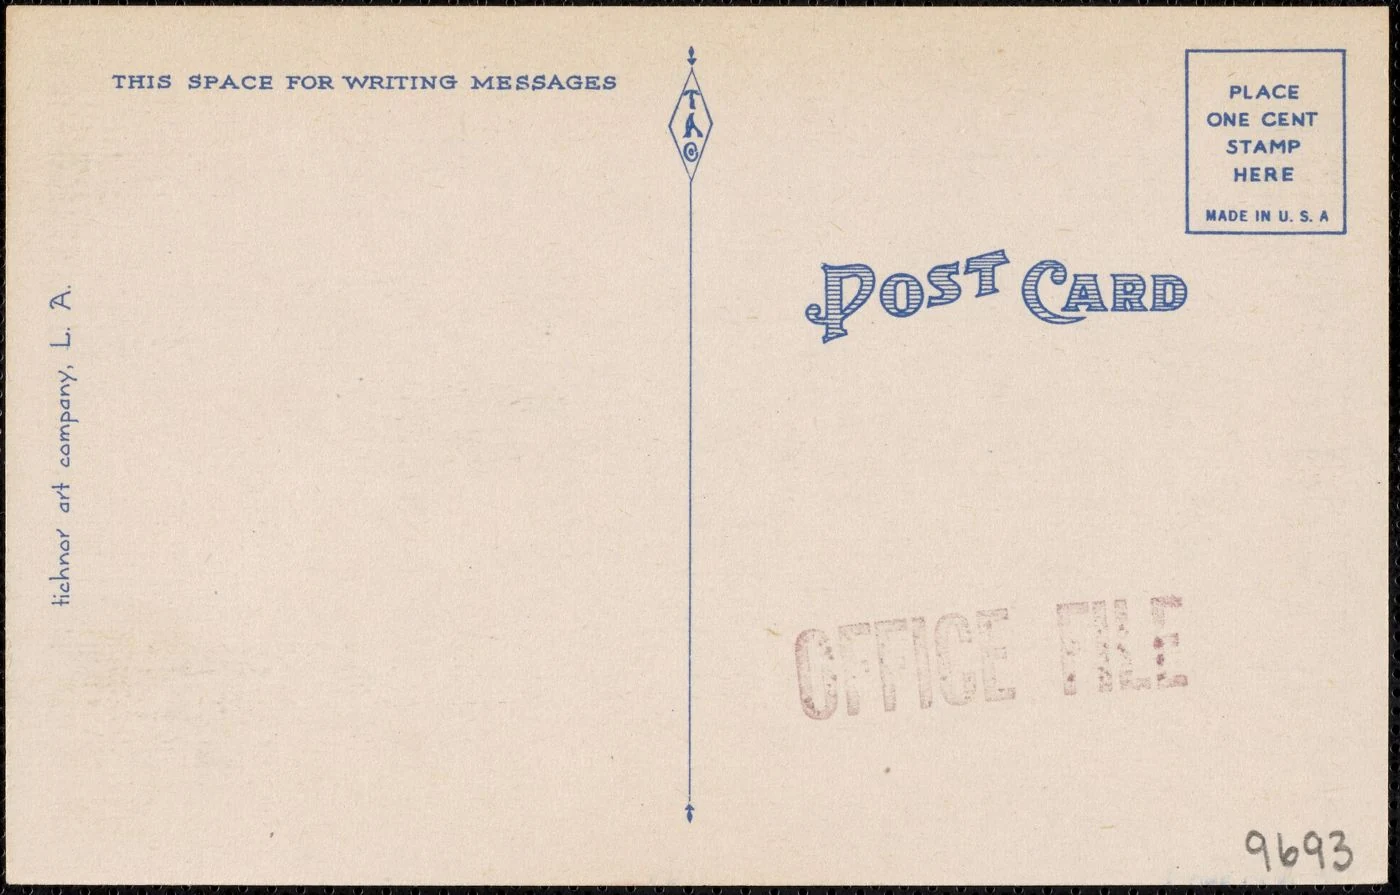
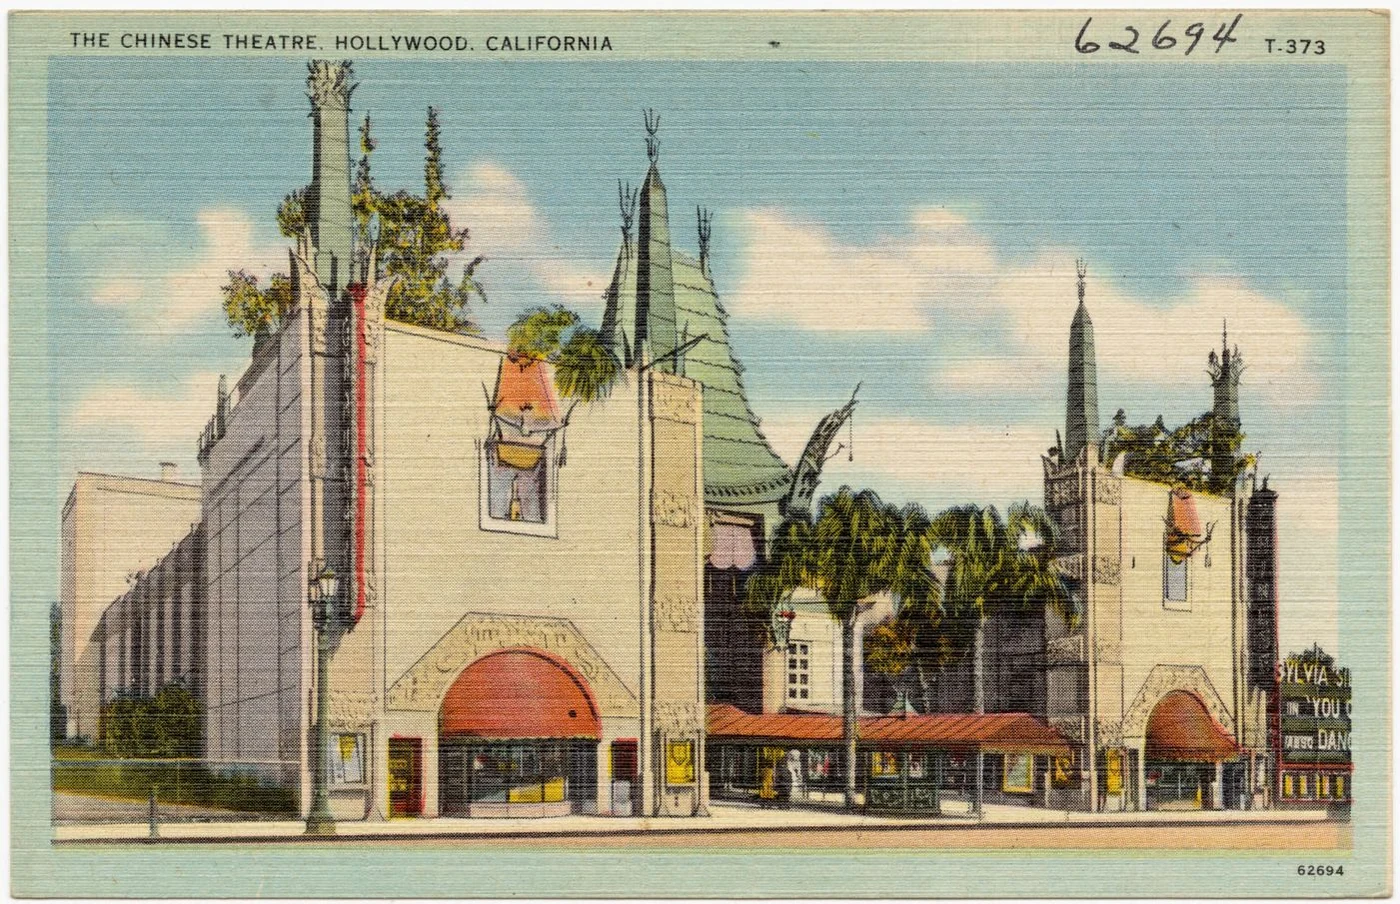
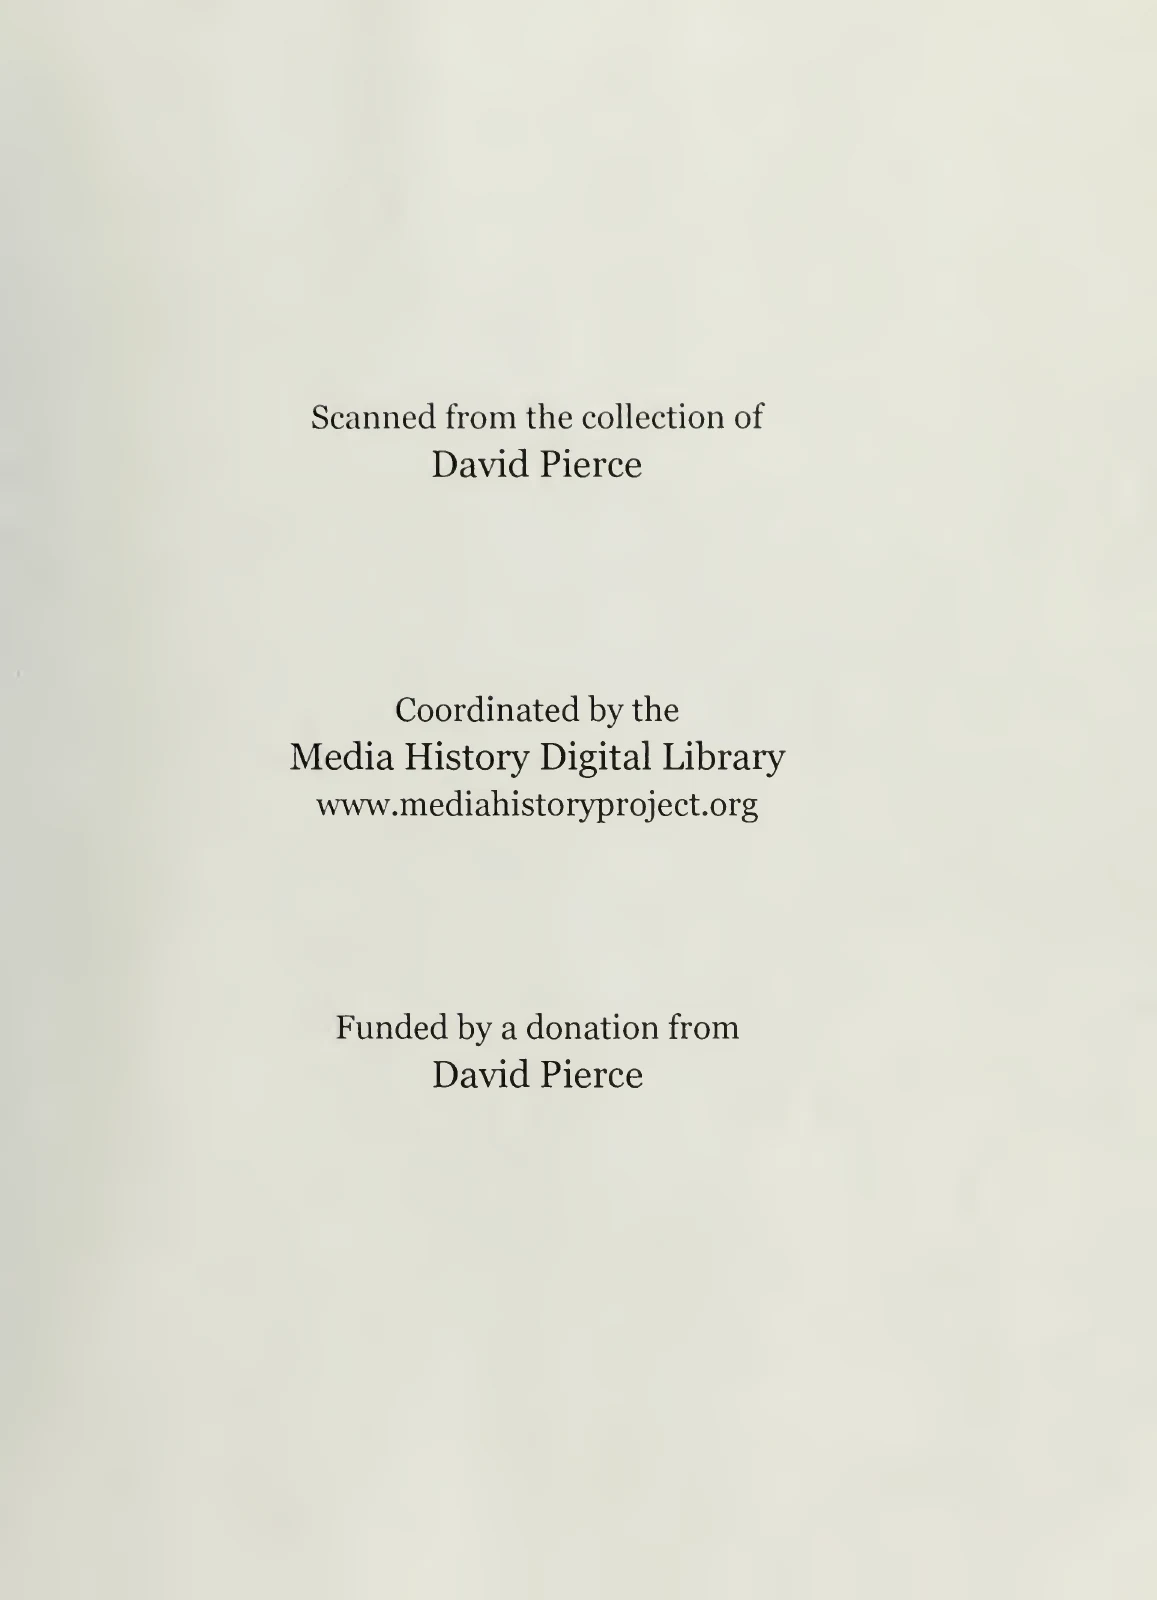
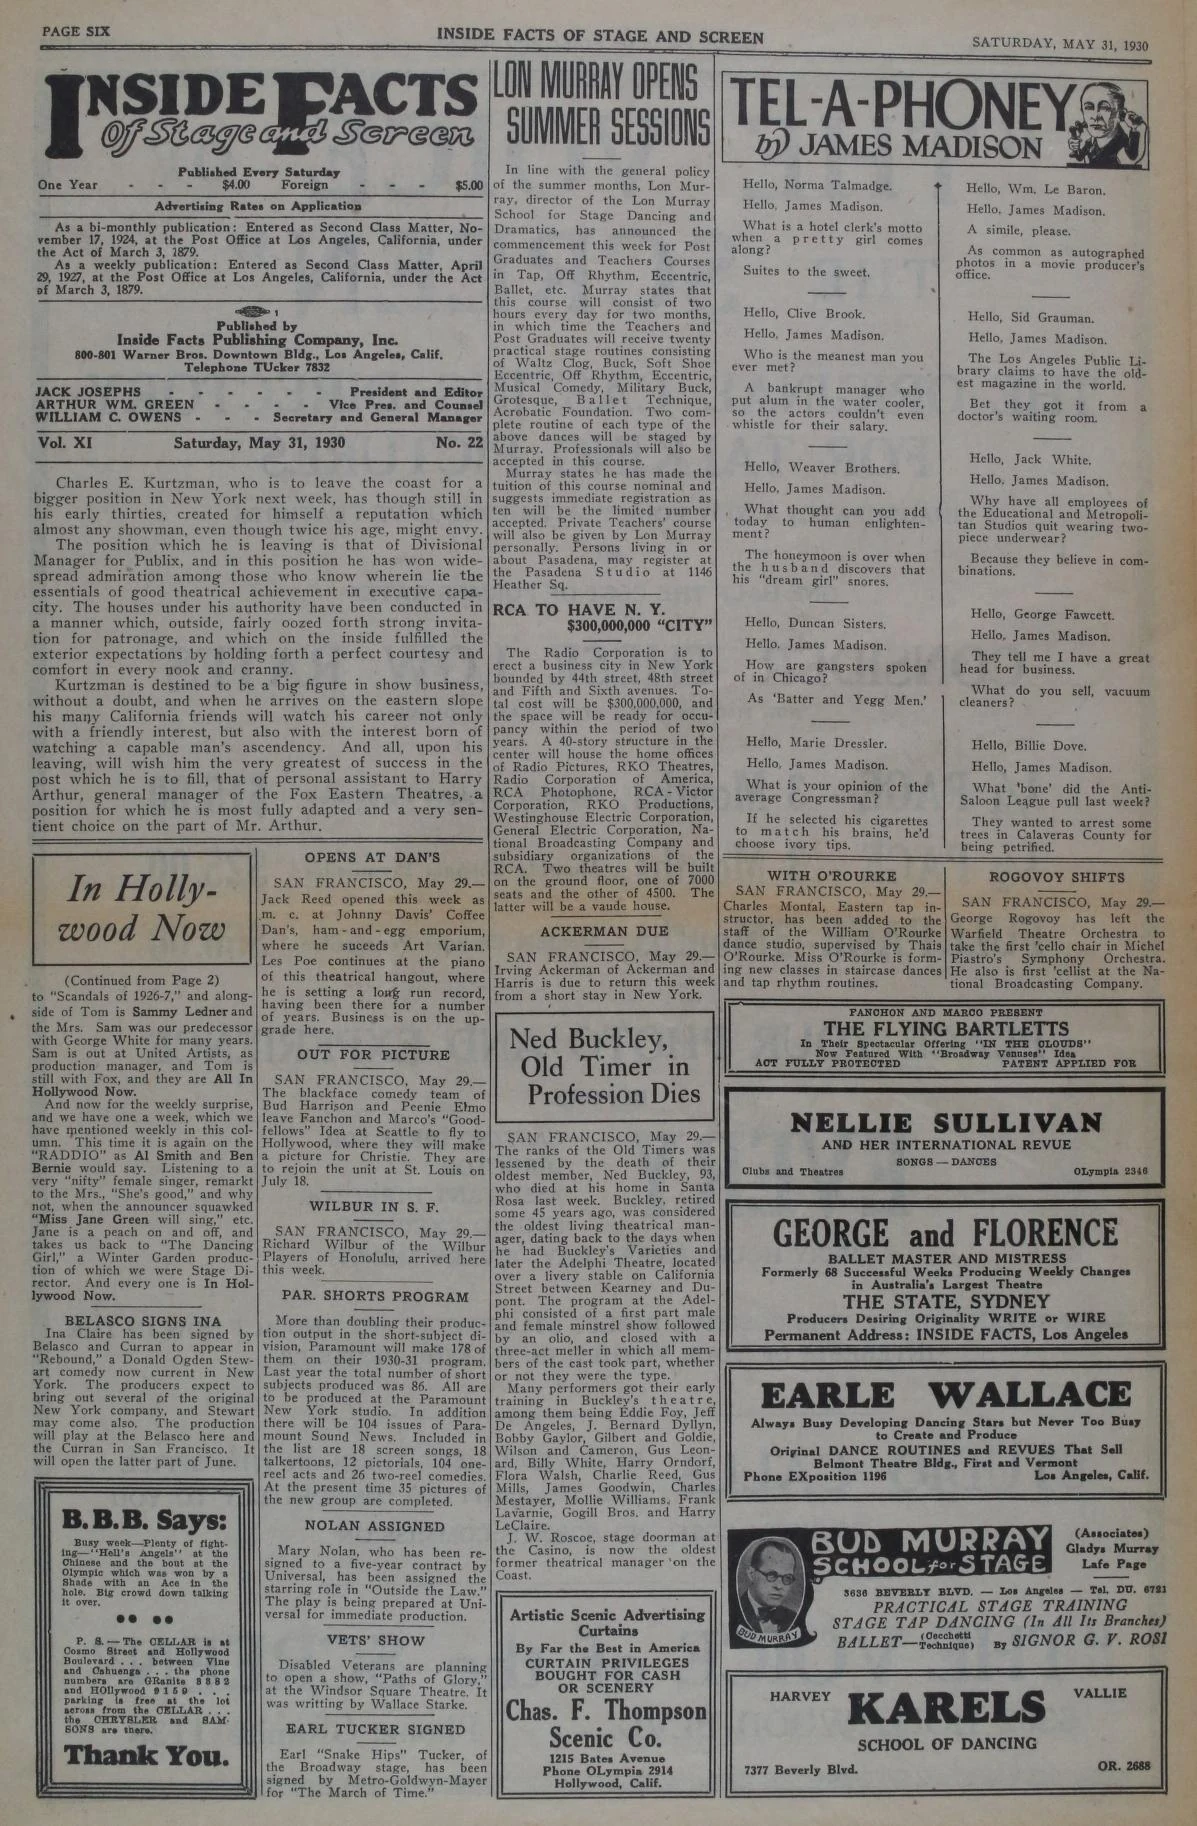
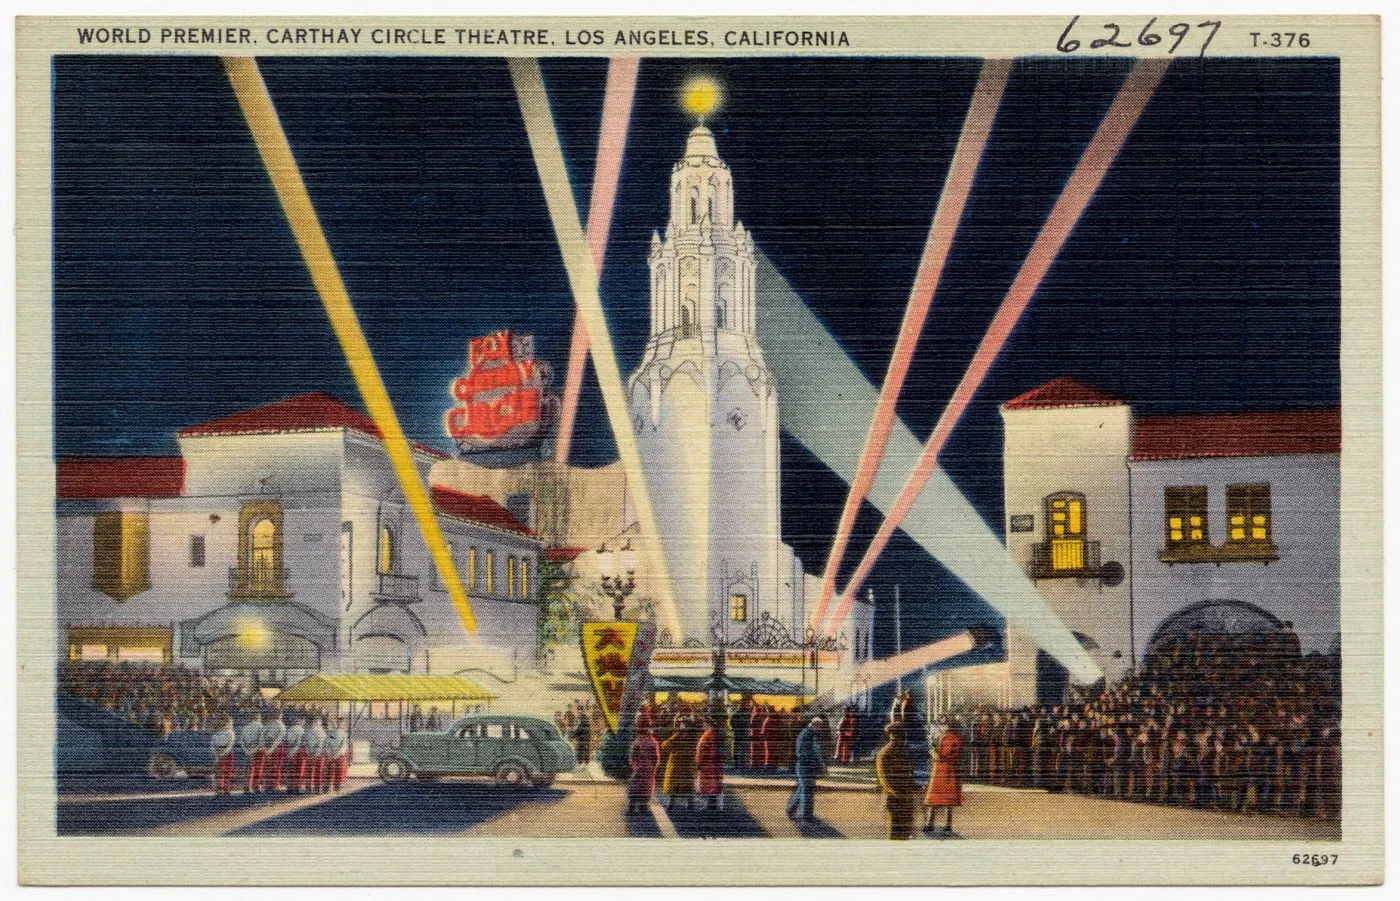
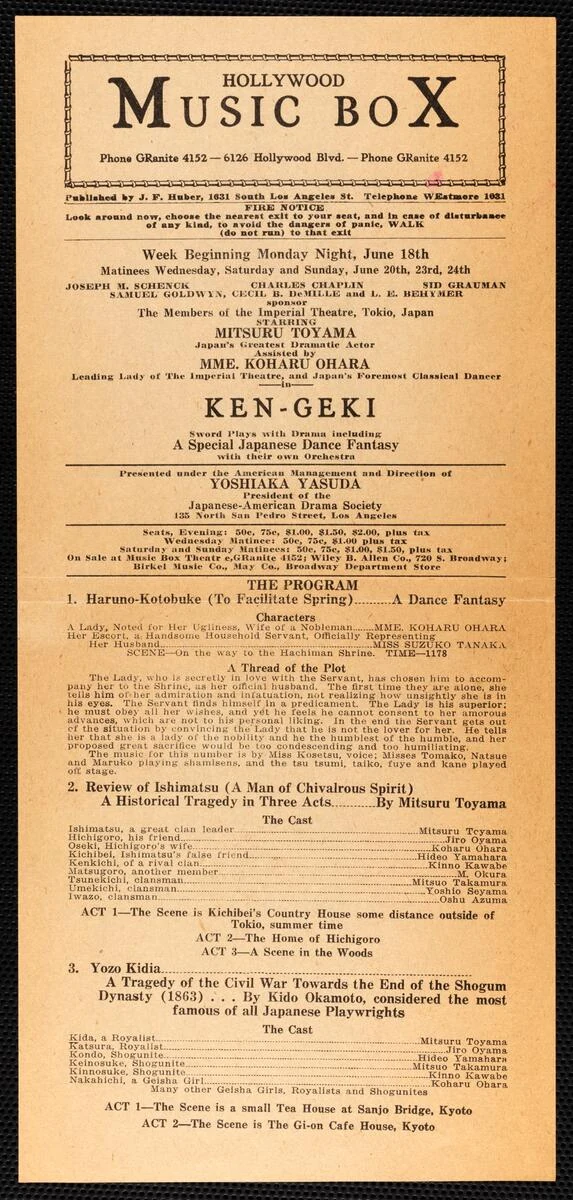
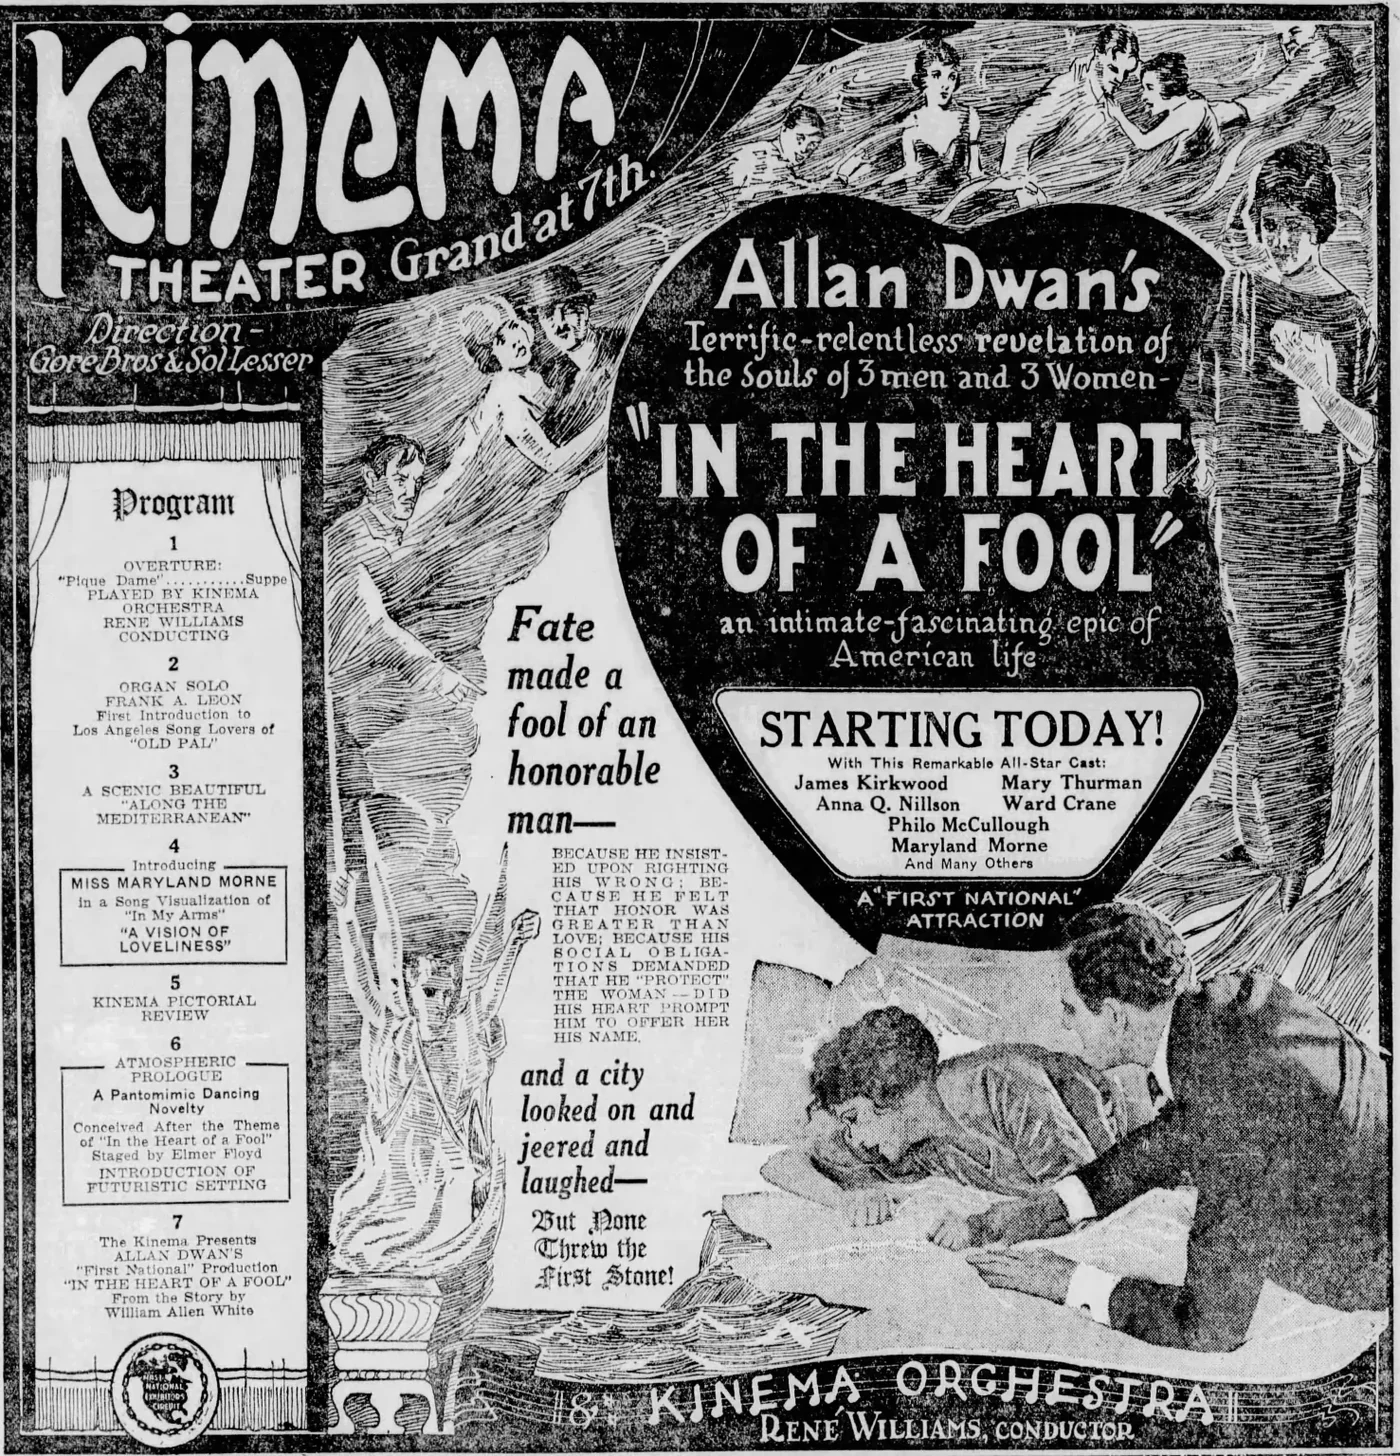
Nine items on one theme — the Los Angeles stage and its picture palaces, c. 1910–1945. Click any of them to see what the engines were actually given. Provenance and rights for every item are in the corpus reference.
The challenge
Why OCR matters for archival work, and what makes historical documents difficult to digitise.
The engines
What exists, how each one works, and the difference between pattern matching, neural recognition and layout understanding.
The corpus
Nine real documents, chosen to span the failure modes that matter in archive digitisation rather than to flatter anything.
The results
What the measurements say: which engine to reach for, and where each one falls down.
What follows
The findings that survived, and the questions still open.
Thousands of documents await digitisation, and every one of them is different
Faded ink and poor contrast
Aged paper and aged ink converge. Letters blend into the ground, and the threshold that recovers one part of a page destroys another.
Decorative typography
Historic mastheads and showbills use hand-lettered, arched and ornamented letterforms that no character model has been trained on.
Complex page layouts
Multi-column articles, mixed sizes, and text flowing around illustration. Finding the words and reading them in the right order are separate problems, and most engines solve only the first.
Volume
Transcribing a collection by hand is not a plan. Whatever runs has to run unattended, and has to say something useful when it fails.
What we measured, and what each one is
Free · local
tesseract
Traditional pattern-matching OCR, and the one everybody already has. Fast, predictable, and entirely dependent on being handed a well-prepared image.
Free · local
tesseract-auto
The same engine with contrast and page-segmentation chosen per image instead of left at the default. Tuning the engine you have turned out to beat switching to a different one.
Free · local
easyocr
A neural detector and recogniser. Finds text regions the others miss, particularly on textured and low-contrast grounds, then struggles to put them in order.
Free · local
easyocr-hy
EasyOCR’s detector with the project’s own Armenian recogniser behind it, and its lines put in column order before they are joined. It is measured here because it is a local backend, not because this corpus suits it: the corpus is English-language, and the model was trained on Armenian print.
Free · local
paddle
Baidu’s detection-and-recognition pipeline. Strong word coverage on dense images, and the best local reader of small type on a busy sheet.
Free · local
paddle-vl
A document vision-language model rather than a detector and classifier: it generates the transcript from the image instead of recognising each glyph in turn. It reads the dense multi-column pages this corpus is hardest on, and reads PDFs and multi-page TIFFs directly.
Free · local
marker
A document-to-Markdown converter rather than an OCR engine: it models the page as structure — headings, columns, tables — and reads within it.
Free · local · macOS
vision
Apple’s on-device recogniser, through the Vision framework. It ships with macOS — no weights to download, no first-call penalty — so on a Mac it joins the fan-out at essentially no cost and reads clean print quickly.
Free · local · routing
auto-local
Not a standalone engine. It runs every local engine eligible for the file, scores the transcripts with no reference text, and keeps the best one. Per file, not per batch.
API · paid · ceiling reference
claude
A vision model, and the source of the reference transcripts every other engine is scored against — including its own. Its column is self-consistency, not accuracy, and it is excluded from every ‘best local’ comparison on this page.
Five documents, and what each one breaks
Document 1 of 5
Inside Facts of Stage and Screen
LA theatrical trade weekly, 31 May 1930 · JPEG
Dense multi-column newsprint under a heavy display masthead, on aged low-contrast paper. Every local engine finds most of the words and then reads them in the wrong order, so recall holds up while character similarity collapses. Finding the text and understanding the page are different problems, and this is the document that separates them.
Character similarity / word recall
tesseract- 0.68 / 0.85
tesseract-auto- 0.90 / 0.91
easyocr- 0.41 / 0.71
easyocr-hy- 0.65 / 0.50
paddle- 0.50 / 0.94
paddle-vl- 0.98 / 0.93
marker- 0.75 / 0.90
vision- 0.63 / 0.88
auto-local- 0.75 / 0.90
claude*- 1.00 / 0.99
Bold is best local. * ceiling reference, not a measurement.
Document 2 of 5
The great Victorina Troupe
Vaudeville chromolithograph, c. 1914 · JPEG
Curved and arched hand-lettered display type, colour on colour, with caption text at the bottom in a size the scan barely holds. Nothing local reads it — plain Tesseract returns essentially nothing at all. The widest gap in the corpus between what a local engine manages and what a vision model does.
Character similarity / word recall
tesseract- 0.01 / 0.00
tesseract-auto- 0.09 / 0.01
easyocr- 0.12 / 0.39
easyocr-hy- 0.10 / 0.00
paddle- 0.27 / 0.38
paddle-vl- 0.29 / 0.44
marker- 0.03 / 0.00
vision- 0.29 / 0.46
auto-local- 0.29 / 0.46
claude*- 0.99 / 0.98
Bold is best local. * ceiling reference, not a measurement.
Document 3 of 5
Carthay Circle Theatre, reverse
Tichnor linen postcard, c. 1930–45 · PNG
Clean printed type, awkwardly arranged: rotated ninety degrees, around a faded rubber stamp and a line of handwriting, with large empty areas between. Auto-configured Tesseract comes within a few points of the ceiling here — free, offline and fast. This is the case where reaching for an API is hard to justify.
Character similarity / word recall
tesseract- 0.59 / 0.50
tesseract-auto- 0.93 / 0.79
easyocr- 0.79 / 0.62
easyocr-hy- 0.49 / 0.08
paddle- 0.28 / 0.62
paddle-vl- 0.68 / 0.79
marker- 0.66 / 0.62
vision- 0.65 / 0.83
auto-local- 0.93 / 0.79
claude*- 0.98 / 0.92
Bold is best local. * ceiling reference, not a measurement.
Document 4 of 5
Grauman’s Chinese Theatre
Tichnor linen postcard, c. 1930–45 · JPEG
A colour halftone where the marquee lettering sits right at the edge of legibility and competes with the image around it. The local engines cluster on character similarity but recover only about half the words, and Marker’s layout model reads the whole card as a figure and returns almost nothing.
Character similarity / word recall
tesseract- 0.66 / 0.44
tesseract-auto- 0.79 / 0.44
easyocr- 0.72 / 0.50
easyocr-hy- 0.61 / 0.06
paddle- 0.74 / 0.19
paddle-vl- 0.72 / 0.31
marker- 0.10 / 0.00
vision- 0.73 / 0.38
auto-local- 0.73 / 0.38
claude*- 0.88 / 0.56
Bold is best local. * ceiling reference, not a measurement.
Document 5 of 5
The King of Kings souvenir programme
Roadshow programme, 1927 · 21-page PDF
The only multi-page item, and the reason PDF support is not a detail: EasyOCR and PaddleOCR cannot open it at all. Tesseract and Marker both manage strong recall on the typeset body text, across tinted grounds, script headings and drop caps.
Character similarity / word recall
tesseract- 0.91 / 0.94
tesseract-auto- 0.91 / 0.94
easyocr- N/A
easyocr-hy- N/A
paddle- N/A
paddle-vl- 0.89 / 0.90
marker- 0.87 / 0.92
vision- N/A
auto-local- 0.87 / 0.92
claude*- 0.93 / 0.97
Bold is best local. * ceiling reference, not a measurement.
Choosing per file beats choosing an engine
Averaged over the whole corpus. Character similarity is order-sensitive and word recall is not, so they are always reported as a pair — the gap between them is where the interesting behaviour lives.
Every engine against every document
| Fixture | tesseract | tesseract-auto | claude* | easyocr | easyocr-hy | paddle | paddle-vl | marker | vision | auto-local |
|---|---|---|---|---|---|---|---|---|---|---|
bancroft-magician-poster.jpg | 0.07/0.00 | 0.28/0.00 | 0.72/0.77 | 0.40/0.14 | 0.17/0.00 | 0.55/0.32 | 0.31/0.14 | 0.17/0.00 | 0.57/0.41 | 0.57/0.41 |
carthay-circle-postcard-back.png | 0.59/0.50 | 0.93/0.79 | 0.98/0.92 | 0.79/0.62 | 0.49/0.08 | 0.28/0.62 | 0.68/0.79 | 0.66/0.62 | 0.65/0.83 | 0.93/0.79 |
carthay-circle-premiere.jpg | 0.00/0.00 | 0.51/0.86 | 0.89/0.93 | 0.87/0.71 | 0.74/0.29 | 0.09/0.00 | 0.88/0.86 | 0.76/0.86 | 0.89/0.93 | 0.51/0.86 |
chinese-theatre-triptych-postcard.jpg | 0.44/0.40 | 0.44/0.40 | 1.00/1.00 | 0.50/0.67 | 0.46/0.00 | 0.79/0.73 | 0.83/0.87 | 0.45/0.47 | 0.66/0.93 | 0.45/0.47 |
graumans-chinese-theatre.jpg | 0.66/0.44 | 0.79/0.44 | 0.88/0.56 | 0.72/0.50 | 0.61/0.06 | 0.74/0.19 | 0.72/0.31 | 0.10/0.00 | 0.73/0.38 | 0.73/0.38 |
greek-theatre-night.jpg | 0.90/0.75 | 0.90/0.75 | 1.00/1.00 | 0.95/0.75 | 0.79/0.00 | 0.91/0.50 | 0.99/0.92 | 0.74/1.00 | 0.98/1.00 | 0.74/1.00 |
hollywood-boulevard-east.jpg | 0.63/0.33 | 0.62/0.33 | 0.93/0.83 | 0.72/0.44 | 0.65/0.17 | 0.64/0.44 | 0.65/0.39 | 0.11/0.00 | 0.68/0.39 | 0.68/0.39 |
hollywood-boulevard-west.jpg | 0.42/0.27 | 0.42/0.27 | 0.96/0.83 | 0.57/0.30 | 0.42/0.17 | 0.58/0.43 | 0.49/0.27 | 0.08/0.00 | 0.53/0.43 | 0.42/0.27 |
hollywood-music-box-playbill-1926.tif | 0.52/0.46 | 0.57/0.53 | 0.99/0.96 | 0.50/0.39 | 0.34/0.26 | 0.78/0.91 | 0.88/0.90 | 0.47/0.74 | 0.69/0.81 | 0.47/0.74 |
inside-facts-1930-cover.jpg | 0.68/0.85 | 0.90/0.91 | 1.00/0.99 | 0.41/0.71 | 0.65/0.50 | 0.50/0.94 | 0.98/0.93 | 0.75/0.90 | 0.63/0.88 | 0.75/0.90 |
inside-facts-1930-page-six.jpg | 0.94/0.91 | 0.94/0.91 | 0.99/0.95 | 0.30/0.78 | 0.61/0.60 | 0.30/0.97 | 0.96/0.95 | 0.74/0.93 | 0.59/0.89 | 0.74/0.93 |
kar-mi-troupe-poster.jpg | 0.01/0.00 | 0.09/0.01 | 0.99/0.98 | 0.12/0.39 | 0.10/0.00 | 0.27/0.38 | 0.29/0.44 | 0.03/0.00 | 0.29/0.46 | 0.29/0.46 |
kinema-theater-ad-1920.tif | 0.45/0.40 | 0.45/0.40 | 0.75/0.98 | 0.42/0.67 | 0.43/0.33 | 0.49/0.93 | 0.74/0.92 | 0.93/0.87 | 0.88/0.91 | 0.93/0.87 |
king-of-kings-souvenir-1927.pdf | 0.91/0.94 | 0.91/0.94 | 0.93/0.97 | N/A | N/A | N/A | 0.89/0.90 | 0.87/0.92 | N/A | 0.87/0.92 |
over-the-fence-poster.jpg | 0.19/0.14 | 0.40/0.18 | 0.77/0.82 | 0.49/0.23 | 0.27/0.14 | 0.64/0.45 | 0.39/0.36 | 0.19/0.00 | 0.54/0.45 | 0.64/0.45 |
parlor-match-poster.jpg | 0.00/0.00 | 0.14/0.03 | 1.00/1.00 | 0.67/0.44 | 0.24/0.00 | 0.68/0.31 | 0.88/0.72 | 0.76/0.75 | 0.79/0.66 | 0.79/0.66 |
thurston-magician-poster.jpg | 0.08/0.04 | 0.26/0.26 | 0.99/0.96 | 0.74/0.52 | 0.12/0.00 | 0.74/0.44 | 0.73/0.63 | 0.72/0.52 | 0.62/0.52 | 0.72/0.52 |
| Average | 0.44/0.38 | 0.56/0.47 | 0.93/0.91 | 0.57/0.52 | 0.44/0.16 | 0.56/0.54 | 0.72/0.66 | 0.50/0.50 | 0.67/0.68 | 0.66/0.65 |
Generated from evaluation/benchmark.csv at build time.
Bold marks the best local backend per fixture.
claude generated the ground truth and is a ceiling reference rather than a score.
The same numbers, drawn
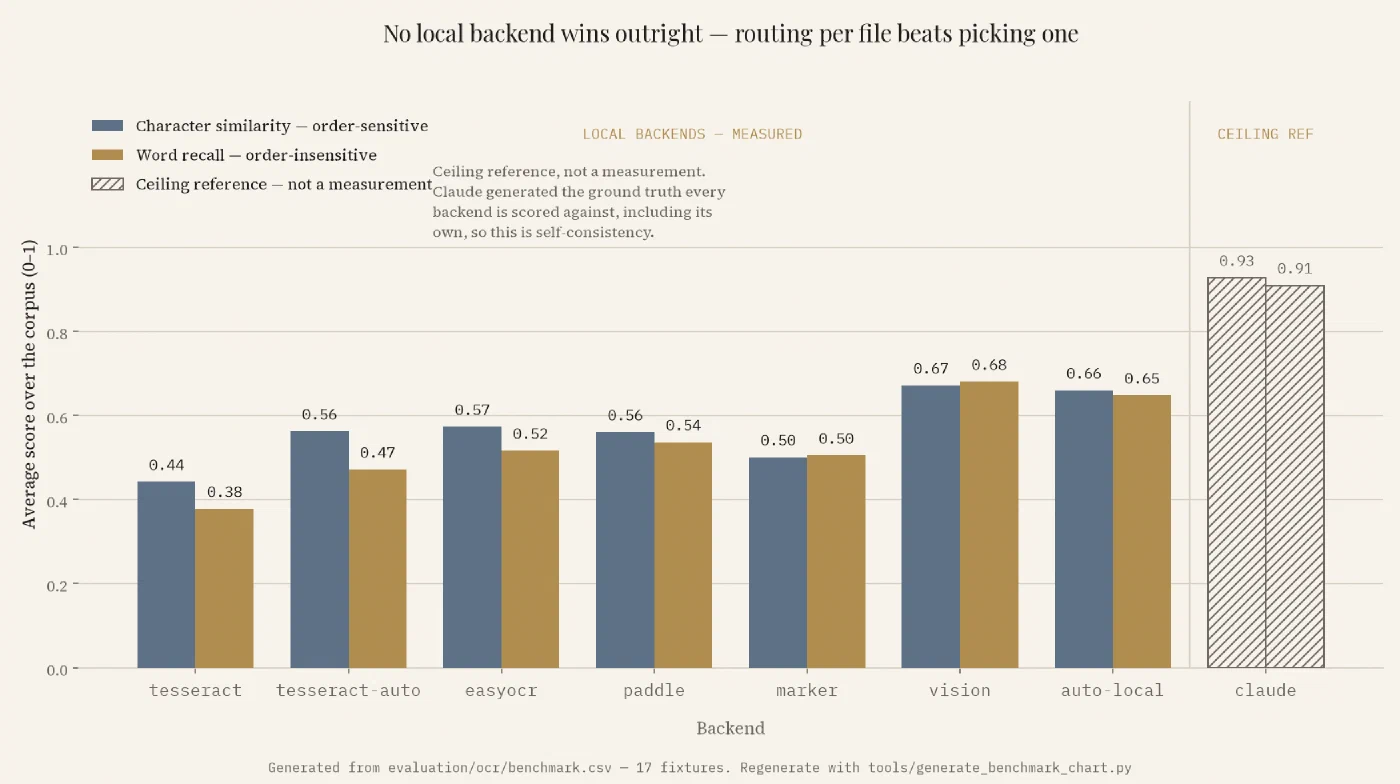
Claude sets a ceiling, and is not a competitor
It generated the reference transcripts every other engine is scored against, including its own. Reading its column as a win is reading the wrong thing. What it does tell you is roughly how much of each document is legible at all.
No single local engine is strong across the corpus
Different engines win on different documents, and the winners are not close to each other. There is no setting you can choose once and be right about, which is the finding that decided the architecture.
Choosing per file closes most of the gap
auto-local runs the engines eligible for each file, scores the transcripts without a reference, and keeps the best. It beats every individual local engine on both metrics, entirely offline and free — and it is still losing ground to an oracle that knows the answer.
Which engine for which material?
- Clean printed captions, postcards, labels
tesseract-autotheneasyocr- Close to the ceiling, free, offline and fast
- Multi-column newsprint and magazines
claudethenmarker- Reading order is the whole problem, and only layout understanding solves it
- Decorative, hand-lettered, ornamental type
claude- Nothing local reads it
- Multi-page PDFs
markerthentesseract- EasyOCR and PaddleOCR cannot read PDFs at all
- Mixed material, run unattended
auto-local- Runs the viable local engines and keeps the best transcript
- Anything confidential
auto-localthentesseract-auto- Everything stays on the machine; no API call
What is still open
The selection heuristic leaves accuracy on the table
auto-local’s scorer loses ground against an oracle that knows which transcript is best. That is a scoring weight rather than an engine limitation, and it is the cheapest accuracy work available.
The auto-configuration bands are overfitted
They were fitted against most of this corpus and need re-fitting on a wider set before they can be trusted elsewhere.
The ground truth is machine-generated
Human-checked reference transcripts would remove the benchmark’s central weakness, and would let Claude be measured rather than assumed.
Nothing here generalises beyond archival print of this era
Same period, same condition, same script. Whether the pipeline holds up on other scripts is untested; an open Armenian Tesseract model exists and would make the cheapest first experiment.
Rights, before anything else
Would the rights attached to a given collection permit sending its scans to a third-party service at all? Where the answer is no, the local path is not a preference, it is the only option.